![[POW!]](images/boxer_l2.gif)
|
To sort by a column, click on the down-pointing triangle above that column.
To reverse the sort,
|
|||||||||||||||||||||||||||||||||||
District Tilt | Progressive Score vs. District Tilt | ||||||||||||||||||||||||||||||||||
|
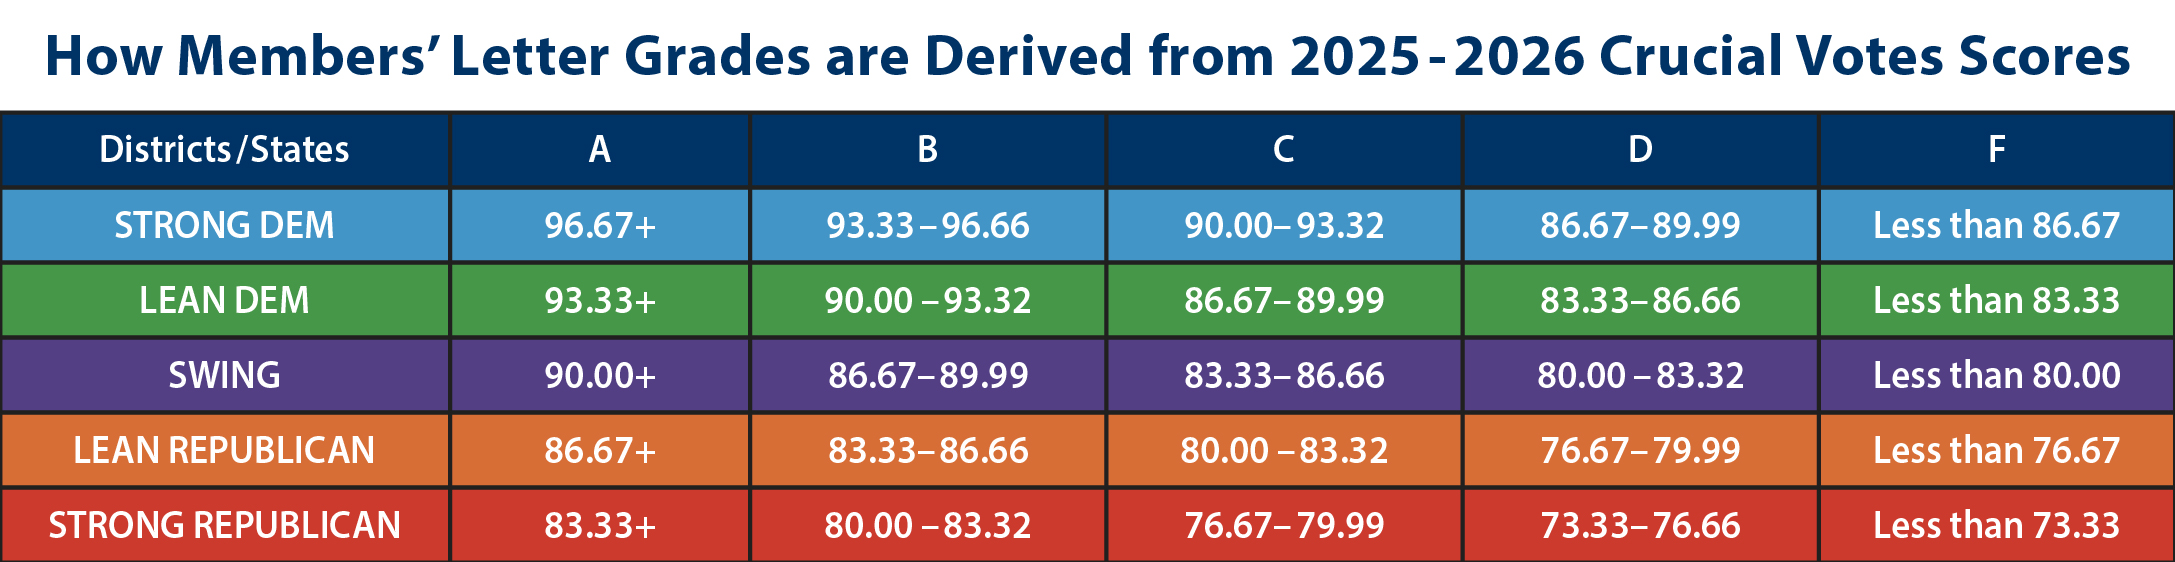
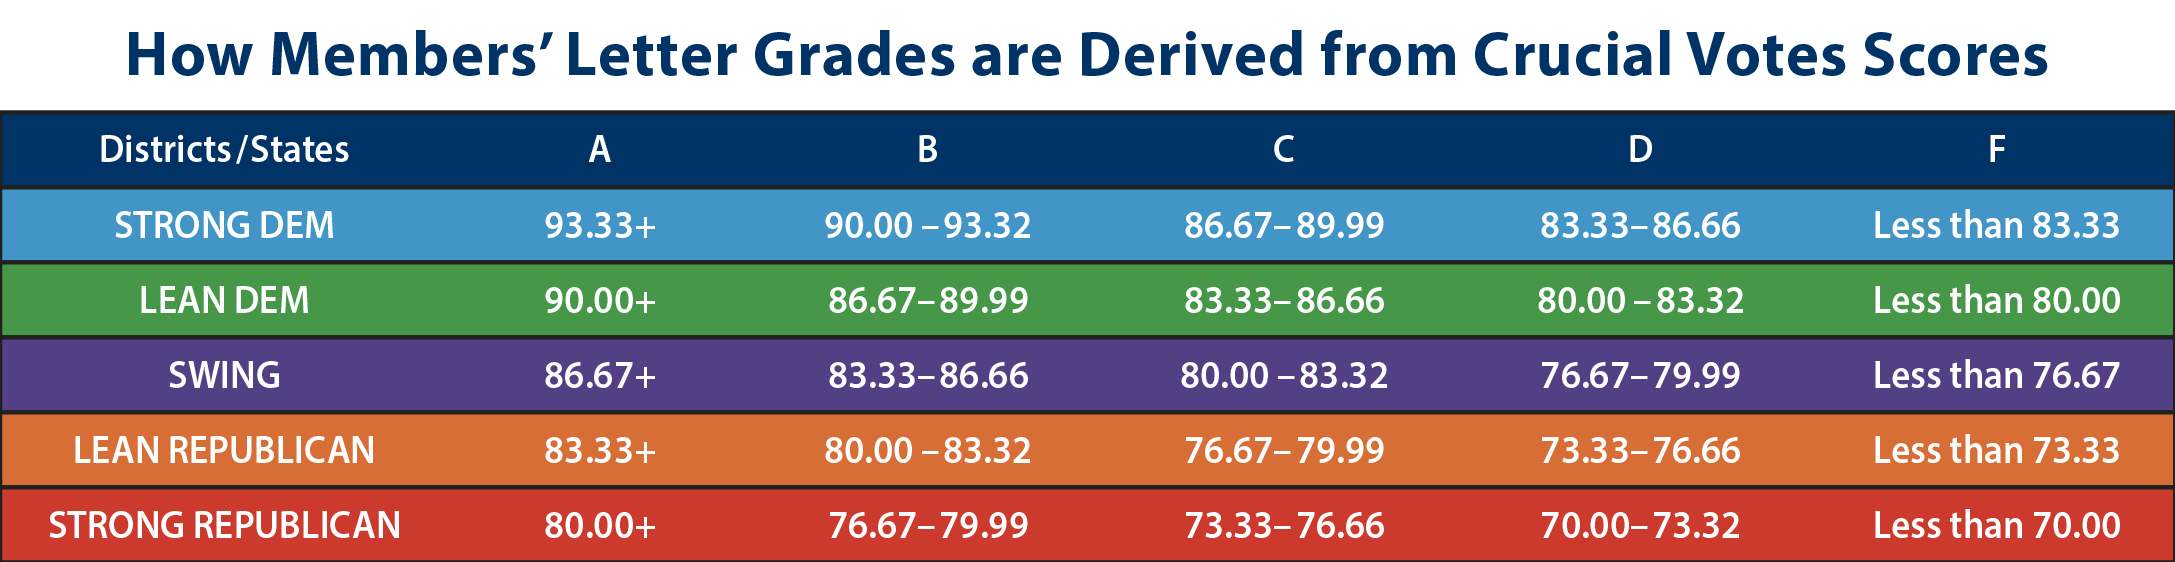
We've assessed the State or District Tilt of each political jurisdiction as indicated below. The assessments are based on what could reasonably be expected to happen in an open seat (no incumbent running) race where no scandal was attached to either candidate. The odds calculations are based on a moderately liberal Democrat's chances of winning [NOT a conservative Democrat] in that District against a Republican candidate. Strong Democratic District = 80-100% chance moderately liberal Democrat wins open seat general election. Leaning Democratic District = 60-80% chance moderately liberal Democrat wins open seat general election. Marginal District = 40-60% chance moderately liberal Democrat wins open seat general election. Leaning Republican District = 20-40% chance moderately liberal Democrat wins open seat general election. Strong Republican District = 0-20% chance moderately liberal Democrat wins open seat general election. |
The “%” and “Rating” columns underneath the “Progressive Score vs. District Tilt” are two different ways of measuring the same thing. They both measure how naughty or nice a member of Congress' voting record has been relative to how hospitable his/her district is to a moderate to liberal Democrat. We're grading on a curve. An A in the “Rating” column indicates members of Congress who are doing the best in terms of voting MORE progressively than could necessarily be expected given their districts. Those with an F rating are performing the worst in relation to their districts. The ever more polarized country was reflected in the House in 2025-2026, causing a “grade inflation” in Democrats' scores.That's reflected in the 2 charts just below, which display the need for a 3.33% increase in minimum score to achieve the same grade in 2025-26 as a member would have needed for the same grade in his/her Lifetime score.
|
||||||||||||||||||||||||||||||||||