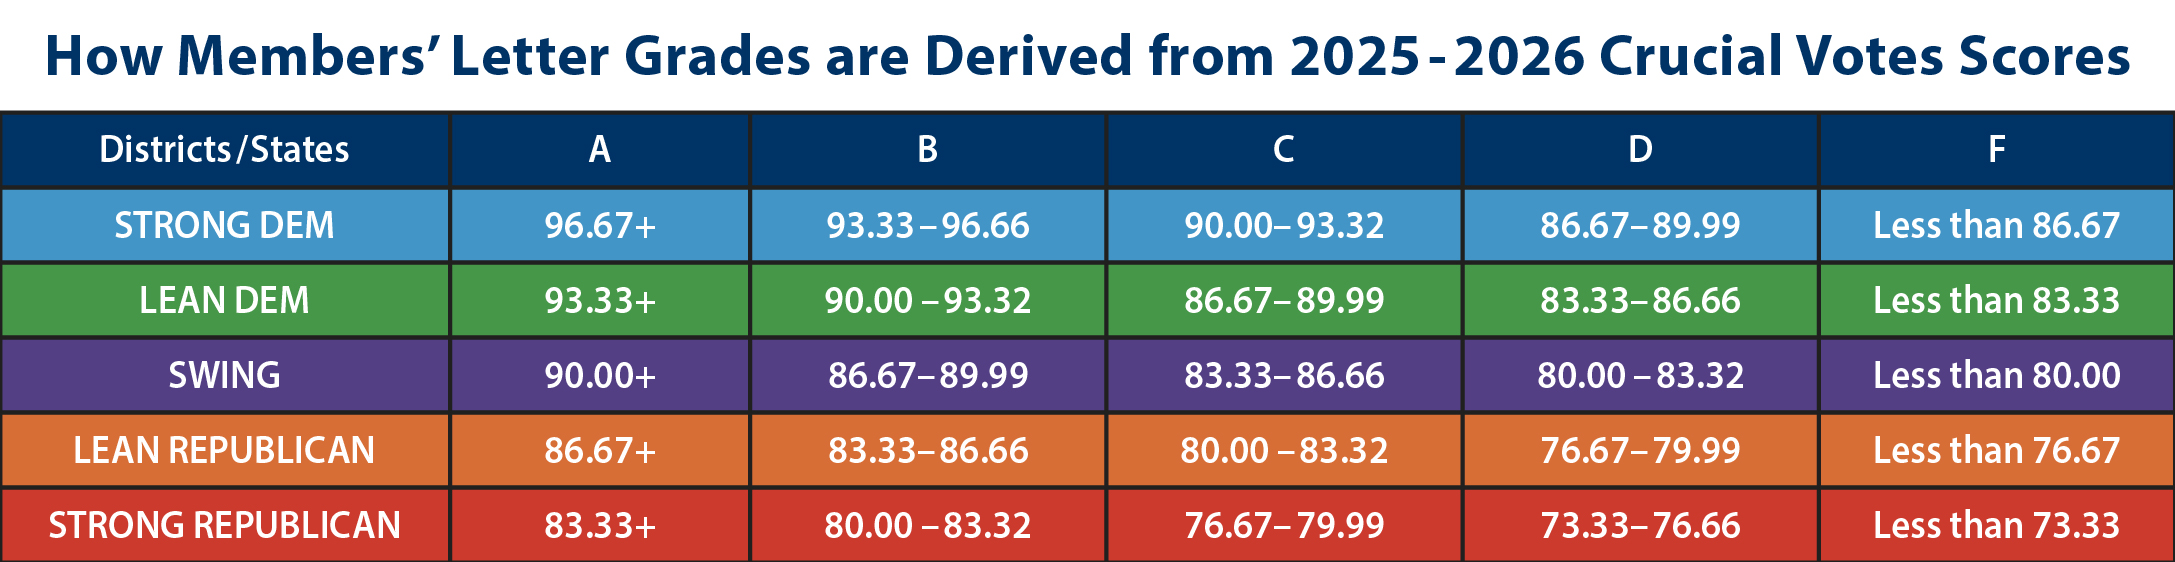
To sort by a column, click on the down-pointing triangle above that column.
To reverse the sort,
click on the triangle above the current sort column and the triangle will now point up once it's reverse sorted.
|
1TIE
|
Balint, Becca
|
D
|
VT-AL
|
Strong Dem
|
99.53
|
100.00
|

|
98.85
|
99.54
|
|
|
1TIE
|
Dexter, Maxine
|
D
|
OR-3
|
Strong Dem
|
99.76
|
100.00
|
|
99.76
|
100.00
|
N/A
(1st Term)
|
|
1TIE
|
Grijalva, Adelita
|
D
|
AZ-7
|
Strong Dem
|
100.00
|
100.00
|
|
100.00
|
100.00
|
N/A
(1st Term)
|
|
1TIE
|
Lee, Summer
|
D
|
PA-12
|
Strong Dem
|
99.76
|
100.00
|
|
99.47
|
100.00
|
|
|
1TIE
|
McIver, LaMonica
|
D
|
NJ-10
|
Strong Dem
|
99.53
|
100.00
|
|
99.35
|
100.00
|
|
|
1TIE
|
Mejia, Analilia
|
D
|
NJ-11
|
Strong Dem
|
97.14
|
100.00
|
|
97.14
|
100.00
|
N/A
(1st Term)
|
|
7TIE
|
Frost, Maxwell
|
D
|
FL-10
|
Strong Dem
|
99.76
|
99.64
|
|
99.08
|
98.92
|
|
|
7TIE
|
Tokuda, Jill
|
D
|
HI-2
|
Strong Dem
|
98.35
|
99.64
|
|
97.94
|
98.92
|
|
|
9
|
DeGette, Diana
|
D
|
CO-1
|
Strong Dem
|
99.05
|
99.64
|
|
95.51
|
92.02
|

|
|
10
|
Velazquez, Nydia
|
D
|
NY-7
|
Strong Dem
|
99.52
|
99.64
|
|
97.21
|
95.98
|
|
|
11TIE
|
Bonamici, Suzanne
|
D
|
OR-1
|
Strong Dem
|
99.06
|
99.28
|
|
97.70
|
95.90
|
|
|
11TIE
|
Green, Al
|
D
|
TX-9
|
Strong Dem
|
98.57
|
99.28
|
|
93.67
|
84.25
|

|
|
11TIE
|
Jacobs, Sara
|
D
|
CA-51
|
Strong Dem
|
99.29
|
99.28
|
|
97.70
|
97.11
|
|
|
14TIE
|
Chu, Judy
|
D
|
CA-28
|
Strong Dem
|
98.35
|
99.28
|
|
98.18
|
97.07
|
|
|
14TIE
|
Takano, Mark
|
D
|
CA-39
|
Strong Dem
|
98.82
|
99.28
|
|
98.00
|
96.15
|
|
|
16TIE
|
Escobar, Veronica
|
D
|
TX-16
|
Strong Dem
|
98.10
|
99.27
|
|
97.51
|
96.51
|
|
|
16TIE
|
McGovern, Jim
|
D
|
MA-2
|
Strong Dem
|
99.52
|
99.27
|
|
97.75
|
97.23
|
|
|
16TIE
|
Scanlon, Mary Gay
|
D
|
PA-5
|
Strong Dem
|
98.81
|
99.27
|
|
97.45
|
95.67
|
|
|
19
|
Tlaib, Rashida
|
D
|
MI-12
|
Strong Dem
|
99.52
|
99.27
|
|
98.01
|
97.71
|
|
|
20TIE
|
Adams, Alma
|
D
|
NC-12
|
Strong Dem
|
98.11
|
98.92
|
|
96.57
|
93.39
|
|
|
20TIE
|
Matsui, Doris
|
D
|
CA-7
|
Strong Dem
|
98.58
|
98.92
|
|
96.38
|
92.06
|
|
|
20TIE
|
Pocan, Mark
|
D
|
WI-2
|
Strong Dem
|
98.35
|
98.92
|
|
98.92
|
98.19
|
|
|
23
|
Rivas, Luz
|
D
|
CA-29
|
Strong Dem
|
98.82
|
98.91
|
|
98.82
|
98.91
|
N/A
(1st Term)
|
|
24TIE
|
Ansari, Yassamin
|
D
|
AZ-3
|
Strong Dem
|
99.04
|
98.91
|
|
99.04
|
98.91
|
N/A
(1st Term)
|
|
24TIE
|
Davis, Danny
|
D
|
IL-7
|
Strong Dem
|
98.33
|
98.91
|
|
96.37
|
93.57
|
|
|
24TIE
|
Stansbury, Melanie
|
D
|
NM-1
|
Strong Dem
|
98.33
|
98.91
|
|
96.90
|
96.79
|
|
|
24TIE
|
Tonko, Paul
|
D
|
NY-20
|
Strong Dem
|
98.10
|
98.91
|
|
96.71
|
93.10
|
|
|
28
|
Menefee, Christian
|
D
|
TX-18
|
Strong Dem
|
99.20
|
98.84
|
|
99.20
|
98.84
|
N/A
(1st Term)
|
|
29TIE
|
Brown, Shontel
|
D
|
OH-11
|
Strong Dem
|
98.35
|
98.56
|
|
96.96
|
97.04
|
|
|
29TIE
|
McGarvey, Morgan
|
D
|
KY-3
|
Strong Dem
|
98.35
|
98.56
|
|
96.72
|
97.24
|
|
|
29TIE
|
Menendez Jr., Rob
|
D
|
NJ-8
|
Strong Dem
|
98.82
|
98.56
|
|
95.41
|
95.08
|
|
|
29TIE
|
Ocasio-Cortez, Alexandria
|
D
|
NY-14
|
Strong Dem
|
98.80
|
98.56
|
|
97.76
|
97.61
|
|
|
29TIE
|
Scott, Bobby
|
D
|
VA-3
|
Strong Dem
|
97.87
|
98.56
|
|
93.06
|
86.72
|

|
|
29TIE
|
Watson Coleman, Bonnie
|
D
|
NJ-12
|
Strong Dem
|
98.58
|
98.56
|
|
98.63
|
97.30
|
|
|
35TIE
|
Huffman, Jared
|
D
|
CA-2
|
Strong Dem
|
99.05
|
98.55
|
|
97.70
|
94.97
|
|
|
35TIE
|
Underwood, Lauren
|
D
|
IL-14
|
Strong Dem
|
98.58
|
98.55
|
|
96.39
|
93.04
|
|
|
37TIE
|
Barragán, Nanette
|
D
|
CA-44
|
Strong Dem
|
97.61
|
98.55
|
|
97.68
|
96.52
|
|
|
37TIE
|
Garcia, Jesús
|
D
|
IL-4
|
Strong Dem
|
98.81
|
98.55
|
|
98.26
|
96.50
|
|
|
39TIE
|
Espaillat, Adriano
|
D
|
NY-13
|
Strong Dem
|
98.57
|
98.54
|
|
98.09
|
97.01
|
|
|
39TIE
|
Foushee, Valerie
|
D
|
NC-4
|
Strong Dem
|
98.80
|
98.54
|
|
97.30
|
97.37
|
|
|
41TIE
|
Castro, Joaquin
|
D
|
TX-20
|
Strong Dem
|
98.80
|
98.53
|
|
96.14
|
91.29
|
|
|
41TIE
|
Garcia, Robert
|
D
|
CA-42
|
Strong Dem
|
98.56
|
98.53
|
|
97.73
|
97.03
|
|
|
43
|
Randall, Emily
|
D
|
WA-6
|
Strong Dem
|
98.80
|
98.53
|
|
98.80
|
98.53
|
N/A
(1st Term)
|
|
44
|
Omar, Ilhan
|
D
|
MN-5
|
Strong Dem
|
98.09
|
98.19
|
|
97.84
|
97.61
|
|
|
45TIE
|
Kelly, Robin
|
D
|
IL-2
|
Strong Dem
|
98.09
|
98.19
|
|
96.94
|
94.00
|
|
|
45TIE
|
Ramirez, Delia
|
D
|
IL-3
|
Strong Dem
|
98.32
|
98.19
|
|
98.84
|
98.61
|
|
|
45TIE
|
Schakowsky, Jan
|
D
|
IL-9
|
Strong Dem
|
98.07
|
98.19
|
|
98.17
|
96.67
|
|
|
48
|
Friedman, Laura
|
D
|
CA-30
|
Strong Dem
|
98.58
|
98.18
|
|
98.58
|
98.18
|
N/A
(1st Term)
|
|
49TIE
|
Doggett, Lloyd
|
D
|
TX-37
|
Strong Dem
|
98.33
|
98.18
|
|
93.45
|
88.87
|
|
|
49TIE
|
Kamlager-Dove, Sydney
|
D
|
CA-37
|
Strong Dem
|
98.55
|
98.18
|
|
97.74
|
97.06
|
|
|
51
|
Pingree, Chellie
|
D
|
ME-1
|
Strong Dem
|
97.82
|
98.15
|
|
97.25
|
94.48
|
|
|
52TIE
|
Hayes, Jahana
|
D
|
CT-5
|
Strong Dem
|
97.17
|
97.83
|
|
95.95
|
92.63
|
|
|
52TIE
|
McClellan, Jennifer
|
D
|
VA-4
|
Strong Dem
|
97.41
|
97.83
|
|
96.11
|
96.69
|
|
|
52TIE
|
Neguse, Joe
|
D
|
CO-2
|
Strong Dem
|
97.88
|
97.83
|
|
97.27
|
96.21
|
|
|
52TIE
|
Raskin, Jamie
|
D
|
MD-8
|
Strong Dem
|
97.64
|
97.83
|
|
98.33
|
97.94
|
|
|
56TIE
|
Johnson, Hank
|
D
|
GA-4
|
Strong Dem
|
97.61
|
97.83
|
|
95.99
|
89.75
|
|
|
56TIE
|
Pressley, Ayanna
|
D
|
MA-7
|
Strong Dem
|
98.33
|
97.83
|
|
98.11
|
97.28
|
|
|
58TIE
|
DeSaulnier, Mark
|
D
|
CA-10
|
Strong Dem
|
97.62
|
97.82
|
|
98.43
|
97.55
|
|
|
58TIE
|
Moore, Gwen
|
D
|
WI-4
|
Strong Dem
|
97.85
|
97.82
|
|
97.09
|
93.72
|
|
|
58TIE
|
Pallone, Frank
|
D
|
NJ-6
|
Strong Dem
|
97.87
|
97.82
|
|
93.86
|
88.34
|
|
|
58TIE
|
Simon, Lateefah
|
D
|
CA-12
|
Strong Dem
|
98.34
|
97.82
|
|
98.34
|
97.82
|
N/A
(1st Term)
|
|
58TIE
|
Vargas, Juan
|
D
|
CA-52
|
Strong Dem
|
98.10
|
97.82
|
|
95.37
|
89.92
|
|
|
63TIE
|
Clarke, Yvette
|
D
|
NY-9
|
Strong Dem
|
98.31
|
97.81
|
|
98.33
|
96.92
|
|
|
63TIE
|
Evans, Dwight
|
D
|
PA-3
|
Strong Dem
|
97.73
|
97.81
|
|
94.84
|
87.30
|
|
|
65
|
Dingell, Debbie
|
D
|
MI-6
|
Strong Dem
|
97.38
|
97.80
|
|
96.71
|
93.09
|
|
|
66
|
Mullin, Kevin
|
D
|
CA-15
|
Strong Dem
|
97.52
|
97.74
|
|
95.35
|
94.84
|
|
|
67
|
Dean, Madeleine
|
D
|
PA-4
|
Strong Dem
|
96.92
|
97.46
|
|
97.03
|
95.56
|
|
|
68
|
Sanchez, Linda
|
D
|
CA-38
|
Strong Dem
|
97.13
|
97.45
|
|
97.19
|
95.18
|
|
|
69
|
Smith, Adam
|
D
|
WA-9
|
Strong Dem
|
96.65
|
97.44
|
|
88.95
|
77.07
|

|
|
70TIE
|
Deluzio, Chris
|
D
|
PA-17
|
Strong Dem
|
96.70
|
97.11
|
|
93.76
|
93.24
|
|
|
70TIE
|
Fletcher , Lizzie
|
D
|
TX-7
|
Strong Dem
|
97.17
|
97.11
|
|
92.38
|
86.89
|
|
|
70TIE
|
McCollum, Betty
|
D
|
MN-4
|
Strong Dem
|
96.70
|
97.11
|
|
95.37
|
90.34
|
|
|
73TIE
|
Carson, André
|
D
|
IN-7
|
Strong Dem
|
97.40
|
97.10
|
|
95.44
|
89.12
|
|
|
73TIE
|
Khanna, Ro
|
D
|
CA-17
|
Strong Dem
|
97.62
|
97.10
|
|
98.06
|
96.91
|
|
|
75TIE
|
Amo, Gabe
|
D
|
RI-1
|
Strong Dem
|
96.93
|
96.75
|
|
95.55
|
96.20
|
|
|
75TIE
|
Clark, Katherine
|
D
|
MA-5
|
Strong Dem
|
96.70
|
96.75
|
|
98.04
|
96.67
|
|
|
75TIE
|
Elfreth, Sarah
|
D
|
MD-3
|
Strong Dem
|
96.93
|
96.75
|
|
96.93
|
96.75
|
N/A
(1st Term)
|
|
75TIE
|
Jeffries, Hakeem
|
D
|
NY-8
|
Strong Dem
|
96.93
|
96.75
|
|
96.90
|
94.19
|
|
|
79TIE
|
Casten, Sean
|
D
|
IL-6
|
Leans Dem
|
96.45
|
96.39
|
|
96.14
|
93.17
|
|
|
79TIE
|
Crow, Jason
|
D
|
CO-6
|
Strong Dem
|
96.70
|
96.39
|
|
94.76
|
89.59
|
|
|
79TIE
|
Ross, Deborah
|
D
|
NC-2
|
Strong Dem
|
96.46
|
96.39
|
|
95.52
|
94.11
|
|
|
82TIE
|
Beyer, Don
|
D
|
VA-8
|
Strong Dem
|
96.91
|
96.38
|
|
96.33
|
91.88
|
|
|
82TIE
|
DeLauro, Rosa
|
D
|
CT-3
|
Strong Dem
|
96.68
|
96.38
|
|
93.82
|
88.17
|
|
|
82TIE
|
Ivey, Glenn
|
D
|
MD-4
|
Strong Dem
|
96.21
|
96.38
|
|
95.56
|
96.00
|
|
|
82TIE
|
Liccardo, Sam
|
D
|
CA-16
|
Strong Dem
|
96.44
|
96.38
|
|
96.44
|
96.38
|
N/A
(1st Term)
|
|
86
|
Meng, Grace
|
D
|
NY-6
|
Strong Dem
|
97.12
|
96.36
|
|
96.16
|
91.34
|
|
|
87TIE
|
Brownley, Julia
|
D
|
CA-26
|
Strong Dem
|
96.15
|
96.35
|
|
92.54
|
81.19
|
|
|
87TIE
|
Sherman, Brad
|
D
|
CA-32
|
Strong Dem
|
96.89
|
96.35
|
|
91.79
|
83.51
|
|
|
89
|
Lofgren, Zoe
|
D
|
CA-18
|
Strong Dem
|
96.42
|
96.34
|
|
93.11
|
88.09
|
|
|
90
|
Crockett, Jasmine
|
D
|
TX-30
|
Strong Dem
|
96.79
|
96.31
|
|
96.16
|
95.64
|
|
|
91TIE
|
Morrison, Kelly
|
D
|
MN-3
|
Strong Dem
|
95.98
|
96.03
|
|
95.98
|
96.03
|
N/A
(1st Term)
|
|
91TIE
|
Salinas, Andrea
|
D
|
OR-6
|
Strong Dem
|
96.23
|
96.03
|
|
93.42
|
91.08
|
|
|
93
|
Waters, Maxine
|
D
|
CA-43
|
Strong Dem
|
96.64
|
96.00
|
|
96.03
|
93.35
|
|
|
94
|
Pettersen, Brittany
|
D
|
CO-7
|
Strong Dem
|
96.53
|
95.98
|
|
92.46
|
89.39
|
|
|
95
|
Mfume, Kweisi
|
D
|
MD-7
|
Strong Dem
|
96.64
|
95.97
|
|
95.00
|
92.83
|
|
|
96
|
Gomez, Jimmy
|
D
|
CA-34
|
Strong Dem
|
97.07
|
95.94
|
|
97.81
|
95.87
|
|
|
97TIE
|
Olszewski, Johnny
|
D
|
MD-2
|
Strong Dem
|
95.98
|
95.65
|
|
95.98
|
95.65
|
N/A
(1st Term)
|
|
97TIE
|
Williams, Nikema
|
D
|
GA-5
|
Strong Dem
|
96.36
|
95.65
|
|
97.81
|
97.48
|
|
|
99TIE
|
Carter, Troy
|
D
|
LA-2
|
Strong Dem
|
95.72
|
95.64
|
|
95.33
|
93.94
|
|
|
99TIE
|
DelBene, Suzan
|
D
|
WA-1
|
Strong Dem
|
95.94
|
95.64
|
|
94.14
|
85.36
|
|
|
99TIE
|
Krishnamoorthi, Raja
|
D
|
IL-8
|
Strong Dem
|
96.16
|
95.64
|
|
95.17
|
89.53
|
|
|
102
|
Garcia, Sylvia
|
D
|
TX-29
|
Strong Dem
|
95.86
|
95.62
|
|
96.60
|
94.67
|
|
|
103
|
Cohen, Steve
|
D
|
TN-9
|
Strong Dem
|
96.13
|
95.59
|
|
95.91
|
91.15
|
|
|
104
|
Pelosi, Nancy
|
D
|
CA-11
|
Strong Dem
|
95.54
|
95.52
|
|
94.85
|
93.02
|
|
|
105
|
Walkinshaw, James
|
D
|
VA-11
|
Strong Dem
|
94.88
|
95.32
|
|
94.88
|
95.32
|
N/A
(1st Term)
|
|
106TIE
|
Cisneros, Gil
|
D
|
CA-31
|
Strong Dem
|
96.23
|
95.31
|
|
95.53
|
88.04
|
|
|
106TIE
|
Larson, John
|
D
|
CT-1
|
Strong Dem
|
95.47
|
95.31
|
|
93.50
|
86.26
|
|
|
108TIE
|
McBride, Sarah
|
D
|
DE-AL
|
Strong Dem
|
96.45
|
95.29
|
|
96.45
|
95.29
|
N/A
(1st Term)
|
|
108TIE
|
Thanedar, Shri
|
D
|
MI-13
|
Strong Dem
|
95.49
|
95.29
|
|
94.20
|
93.85
|
|
|
110
|
Clyburn, Jim
|
D
|
SC-6
|
Strong Dem
|
95.70
|
95.27
|
|
91.92
|
83.40
|
|
|
111
|
Hoyle, Val
|
D
|
OR-4
|
Strong Dem
|
95.71
|
94.95
|
|
95.05
|
93.64
|
|
|
112
|
Cleaver, Emanuel
|
D
|
MO-5
|
Strong Dem
|
95.39
|
94.91
|
|
94.59
|
87.67
|
|
|
113TIE
|
Ruiz, Raul
|
D
|
CA-25
|
Leans Dem
|
95.24
|
94.89
|
|
90.82
|
77.96
|
|
|
113TIE
|
Torres, Norma
|
D
|
CA-35
|
Strong Dem
|
94.99
|
94.89
|
|
94.82
|
88.11
|
|
|
115
|
Strickland, Marilyn
|
D
|
WA-10
|
Strong Dem
|
95.45
|
94.87
|
|
94.42
|
91.87
|
|
|
116
|
Goldman, Dan
|
D
|
NY-10
|
Strong Dem
|
96.02
|
94.78
|
|
93.46
|
90.62
|
|
|
117
|
Garamendi, John
|
D
|
CA-8
|
Strong Dem
|
93.95
|
94.70
|
|
93.12
|
84.70
|
|
|
118TIE
|
Thompson, Bennie
|
D
|
MS-2
|
Strong Dem
|
95.22
|
94.58
|
|
92.01
|
83.71
|
|
|
118TIE
|
Thompson, Mike
|
D
|
CA-4
|
Strong Dem
|
94.81
|
94.58
|
|
92.62
|
83.83
|
|
|
120TIE
|
Aguilar, Pete
|
D
|
CA-33
|
Strong Dem
|
95.27
|
94.57
|
|
93.05
|
82.84
|
|
|
120TIE
|
Bell, Wesley
|
D
|
MO-1
|
Strong Dem
|
95.22
|
94.57
|
|
95.22
|
94.57
|
N/A
(1st Term)
|
|
120TIE
|
Meeks, Gregory
|
D
|
NY-5
|
Strong Dem
|
95.19
|
94.57
|
|
93.35
|
86.16
|
|
|
123
|
Nadler, Jerry
|
D
|
NY-12
|
Strong Dem
|
95.43
|
94.36
|
|
96.85
|
95.06
|
|
|
124TIE
|
Neal, Richard
|
D
|
MA-1
|
Strong Dem
|
94.94
|
94.14
|
|
93.39
|
86.90
|
|
|
124TIE
|
Trahan, Lori
|
D
|
MA-3
|
Strong Dem
|
95.17
|
94.14
|
|
96.94
|
94.89
|
|
|
126
|
Norcross, Donald
|
D
|
NJ-1
|
Strong Dem
|
94.82
|
94.12
|
|
93.71
|
84.25
|
|
|
127
|
Frankel, Lois
|
D
|
FL-22
|
Leans Dem
|
94.87
|
94.05
|
|
95.00
|
88.51
|
|
|
128TIE
|
Foster, Bill
|
D
|
IL-11
|
Strong Dem
|
94.58
|
93.86
|
|
91.69
|
79.69
|
|
|
128TIE
|
Kennedy, Tim
|
D
|
NY-26
|
Strong Dem
|
94.81
|
93.86
|
|
93.88
|
91.73
|
|
|
130TIE
|
Fields, Cleo
|
D
|
LA-6
|
Strong Dem
|
94.23
|
93.80
|
|
90.63
|
86.49
|
|
|
130TIE
|
Keating, Bill
|
D
|
MA-9
|
Strong Dem
|
94.66
|
93.80
|
|
93.74
|
85.30
|
|
|
130TIE
|
Larsen, Rick
|
D
|
WA-2
|
Strong Dem
|
94.74
|
93.80
|
|
91.14
|
78.81
|
|
|
133
|
Jayapal, Pramila
|
D
|
WA-7
|
Strong Dem
|
95.62
|
93.73
|
|
98.46
|
95.84
|
|
|
134
|
Beatty, Joyce
|
D
|
OH-3
|
Strong Dem
|
94.58
|
93.66
|
|
95.66
|
90.71
|
|
|
135
|
Latimer, George
|
D
|
NY-16
|
Strong Dem
|
94.46
|
93.45
|
|
94.46
|
93.45
|
N/A
(1st Term)
|
|
136TIE
|
Bera, Ami
|
D
|
CA-6
|
Strong Dem
|
93.79
|
93.43
|
|
90.31
|
76.24
|
|
|
136TIE
|
Lieu, Ted
|
D
|
CA-36
|
Strong Dem
|
94.27
|
93.43
|
|
95.67
|
90.30
|
|
|
138TIE
|
Carbajal, Salud
|
D
|
CA-24
|
Strong Dem
|
93.87
|
93.14
|
|
93.88
|
86.90
|
|
|
138TIE
|
Pou, Nellie
|
D
|
NJ-9
|
Swing
|
94.58
|
93.14
|
|
94.58
|
93.14
|
N/A
(1st Term)
|
|
138TIE
|
Subramanyam, Suhas
|
D
|
VA-10
|
Strong Dem
|
94.58
|
93.14
|
|
94.58
|
93.14
|
N/A
(1st Term)
|
|
141
|
Quigley, Mike
|
D
|
IL-5
|
Strong Dem
|
93.93
|
93.04
|
|
94.31
|
86.75
|
|
|
142
|
Castor, Kathy
|
D
|
FL-14
|
Strong Dem
|
94.06
|
92.78
|
|
94.76
|
87.55
|
|
|
143
|
Wasserman Schultz, Debbie
|
D
|
FL-25
|
Leans Dem
|
94.52
|
92.75
|
|
93.88
|
84.87
|
|
|
144
|
Jackson, Jonathan
|
D
|
IL-1
|
Strong Dem
|
94.16
|
92.67
|
|
95.60
|
94.13
|
|
|
145
|
Min, Dave
|
D
|
CA-47
|
Leans Dem
|
93.38
|
92.42
|
|
93.38
|
92.42
|
N/A
(1st Term)
|
|
146TIE
|
Hoyer, Steny
|
D
|
MD-5
|
Strong Dem
|
93.33
|
92.39
|
|
89.97
|
78.84
|
|
|
146TIE
|
Stevens, Haley
|
D
|
MI-11
|
Strong Dem
|
93.62
|
92.39
|
|
94.43
|
89.06
|
|
|
148
|
Boyle, Brendan
|
D
|
PA-2
|
Strong Dem
|
93.99
|
92.28
|
|
94.62
|
87.01
|
|
|
149
|
Leger Fernandez, Teresa
|
D
|
NM-3
|
Leans Dem
|
94.10
|
92.19
|
|
95.71
|
94.18
|
|
|
150
|
Case, Ed
|
D
|
HI-1
|
Strong Dem
|
92.67
|
92.03
|
|
87.21
|
77.60
|
|
|
151TIE
|
Morelle, Joseph
|
D
|
NY-25
|
Strong Dem
|
93.60
|
91.70
|
|
94.01
|
87.80
|
|
|
151TIE
|
Torres, Ritchie
|
D
|
NY-15
|
Strong Dem
|
93.84
|
91.70
|
|
94.61
|
92.16
|
|
|
153TIE
|
Johnson, Julie
|
D
|
TX-32
|
Strong Dem
|
92.55
|
91.67
|
|
92.55
|
91.67
|
N/A
(1st Term)
|
|
153TIE
|
Magaziner, Seth
|
D
|
RI-2
|
Strong Dem
|
93.06
|
91.67
|
|
90.69
|
85.74
|
|
|
155
|
Conaway, Herb
|
D
|
NJ-3
|
Strong Dem
|
93.32
|
91.64
|
|
93.32
|
91.64
|
N/A
(1st Term)
|
|
156
|
Levin, Mike
|
D
|
CA-49
|
Leans Dem
|
92.92
|
91.34
|
|
93.96
|
87.55
|
|
|
157
|
Himes, Jim
|
D
|
CT-4
|
Strong Dem
|
92.87
|
91.30
|
|
90.80
|
78.54
|
|
|
158
|
Moulton, Seth
|
D
|
MA-6
|
Strong Dem
|
93.62
|
91.22
|
|
93.39
|
84.16
|
|
|
159TIE
|
Craig, Angie
|
D
|
MN-2
|
Strong Dem
|
92.65
|
90.61
|
|
88.42
|
78.63
|
|
|
159TIE
|
Figures, Shomari
|
D
|
AL-2
|
Strong Dem
|
91.92
|
90.61
|
|
91.92
|
90.61
|
N/A
(1st Term)
|
|
159TIE
|
Peters, Scott
|
D
|
CA-50
|
Strong Dem
|
91.94
|
90.61
|
|
87.59
|
72.61
|
|
|
159TIE
|
Sewell, Terri
|
D
|
AL-7
|
Strong Dem
|
92.89
|
90.61
|
|
90.76
|
77.66
|
|
|
163TIE
|
Lynch, Stephen
|
D
|
MA-8
|
Strong Dem
|
92.64
|
90.58
|
|
91.89
|
80.69
|
|
|
163TIE
|
McClain-Delaney, April
|
D
|
MD-6
|
Strong Dem
|
91.94
|
90.58
|
|
91.94
|
90.58
|
N/A
(1st Term)
|
|
165
|
Bynum, Janelle
|
D
|
OR-5
|
Strong Dem
|
91.96
|
90.25
|
|
91.96
|
90.25
|
N/A
(1st Term)
|
|
166TIE
|
Auchincloss, Jake
|
D
|
MA-4
|
Strong Dem
|
91.53
|
89.49
|
|
94.66
|
92.03
|
|
|
166TIE
|
Bishop, Sanford
|
D
|
GA-2
|
Strong Dem
|
90.21
|
89.49
|
|
81.34
|
62.64
|
|
|
166TIE
|
Schneider, Brad
|
D
|
IL-10
|
Strong Dem
|
91.67
|
89.49
|
|
89.23
|
76.64
|
|
|
169TIE
|
Budzinski, Nikki
|
D
|
IL-13
|
Strong Dem
|
91.27
|
89.17
|
|
88.97
|
84.33
|
|
|
169TIE
|
Mannion, John
|
D
|
NY-22
|
Strong Dem
|
90.80
|
89.17
|
|
90.80
|
89.17
|
N/A
(1st Term)
|
|
171
|
Veasey, Mark
|
D
|
TX-33
|
Strong Dem
|
90.19
|
89.09
|
|
92.34
|
82.27
|
|
|
172
|
Sykes, Emilia
|
D
|
OH-13
|
Swing
|
91.43
|
88.77
|
|
91.01
|
86.75
|
|
|
173
|
Titus, Dina
|
D
|
NV-1
|
Leans Dem
|
90.70
|
88.36
|
|
93.82
|
83.73
|
|
|
174
|
Houlahan, Chrissy
|
D
|
PA-6
|
Strong Dem
|
89.81
|
88.00
|
|
91.46
|
82.41
|
|
|
175TIE
|
Ryan, Pat
|
D
|
NY-18
|
Leans Dem
|
90.31
|
87.36
|
|
87.97
|
82.13
|
|
|
175TIE
|
Soto, Darren
|
D
|
FL-9
|
Leans Dem
|
90.09
|
87.36
|
|
93.40
|
85.05
|
|
|
177TIE
|
Davids, Sharice
|
D
|
KS-3
|
Leans Dem
|
89.36
|
87.32
|
|
91.87
|
83.21
|
|
|
177TIE
|
McBath, Lucy
|
D
|
GA-6
|
Strong Dem
|
90.34
|
87.32
|
|
93.44
|
86.74
|
|
|
179
|
Stanton, Greg
|
D
|
AZ-4
|
Strong Dem
|
90.21
|
87.23
|
|
92.02
|
83.42
|
|
|
180
|
Correa, Lou
|
D
|
CA-46
|
Strong Dem
|
87.86
|
87.13
|
|
91.75
|
84.12
|
|
|
181
|
Horsford, Steven
|
D
|
NV-4
|
Leans Dem
|
89.05
|
86.96
|
|
92.11
|
82.57
|
|
|
182
|
Casar, Greg
|
D
|
TX-35
|
Strong Dem
|
91.16
|
86.89
|
|
96.64
|
93.92
|
|
|
183
|
Courtney, Joe
|
D
|
CT-2
|
Strong Dem
|
89.83
|
86.64
|
|
92.97
|
80.38
|
|
|
184TIE
|
Harder, Josh
|
D
|
CA-9
|
Swing
|
88.92
|
86.28
|
|
90.18
|
79.50
|
|
|
184TIE
|
Sorensen, Eric
|
D
|
IL-17
|
Leans Dem
|
89.15
|
86.28
|
|
87.11
|
81.73
|
|
|
186
|
Schrier, Kim
|
D
|
WA-8
|
Leans Dem
|
88.84
|
85.92
|
|
90.48
|
80.39
|
|
|
187
|
Panetta, Jimmy
|
D
|
CA-19
|
Strong Dem
|
88.92
|
85.56
|
|
91.80
|
81.25
|
|
|
188
|
Scholten, Hilary
|
D
|
MI-3
|
Strong Dem
|
89.10
|
85.51
|
|
88.37
|
82.62
|
|
|
189
|
Mrvan, Frank
|
D
|
IN-1
|
Leans Dem
|
88.52
|
85.40
|
|
90.62
|
83.82
|
|
|
190
|
Tran, Derek
|
D
|
CA-45
|
Swing
|
88.44
|
85.20
|
|
88.44
|
85.20
|
N/A
(1st Term)
|
|
191
|
Whitesides, George
|
D
|
CA-27
|
Leans Dem
|
87.98
|
84.67
|
|
87.98
|
84.67
|
N/A
(1st Term)
|
|
192
|
Vasquez, Gabe
|
D
|
NM-2
|
Swing
|
86.32
|
84.48
|
|
86.29
|
81.57
|
|
|
193
|
Kaptur, Marcy
|
D
|
OH-9
|
Leans Rep
|
85.00
|
84.12
|
|
88.66
|
76.59
|
|
|
194TIE
|
Goodlander, Maggie
|
D
|
NH-2
|
Leans Dem
|
87.50
|
83.75
|
|
87.50
|
83.75
|
N/A
(1st Term)
|
|
194TIE
|
Landsman, Greg
|
D
|
OH-1
|
Strong Dem
|
87.03
|
83.75
|
|
85.50
|
79.48
|
|
|
196
|
McDonald Rivet, Kristen
|
D
|
MI-8
|
Swing
|
84.86
|
83.58
|
|
84.86
|
83.58
|
N/A
(1st Term)
|
|
197
|
Costa, Jim
|
D
|
CA-21
|
Leans Dem
|
83.21
|
83.39
|
|
77.05
|
56.62
|
|
|
198
|
Vindman, Eugene
|
D
|
VA-7
|
Leans Dem
|
85.07
|
82.67
|
|
85.07
|
82.67
|
N/A
(1st Term)
|
|
199
|
Moskowitz, Jared
|
D
|
FL-23
|
Swing
|
85.82
|
82.48
|
|
84.35
|
77.36
|
|
|
200TIE
|
Lee, Susie
|
D
|
NV-3
|
Swing
|
84.91
|
82.31
|
|
88.72
|
77.40
|
|
|
200TIE
|
Pappas, Chris
|
D
|
NH-1
|
Leans Dem
|
86.56
|
82.31
|
|
89.32
|
78.68
|
|
|
202
|
Riley, Josh
|
D
|
NY-19
|
Leans Dem
|
85.48
|
81.82
|
|
85.48
|
81.82
|
N/A
(1st Term)
|
|
203
|
Wilson, Frederica
|
D
|
FL-24
|
Strong Dem
|
86.09
|
81.23
|
|
94.80
|
87.65
|
|
|
204
|
Suozzi, Thomas
|
D
|
NY-3
|
Leans Rep
|
81.47
|
80.51
|
|
88.86
|
75.15
|
|
|
205
|
Gillen, Laura
|
D
|
NY-4
|
Leans Dem
|
80.14
|
79.56
|
|
80.14
|
79.56
|
N/A
(1st Term)
|
|
206
|
Gluesenkamp Perez, Marie
|
D
|
WA-3
|
Swing
|
69.19
|
77.98
|
|
69.57
|
73.12
|
|
|
207
|
Davis, Don
|
D
|
NC-1
|
Swing
|
68.87
|
77.26
|
|
72.80
|
72.92
|
|
|
208
|
González, Vicente
|
D
|
TX-34
|
Leans Rep
|
70.71
|
77.17
|
|
85.30
|
76.19
|
|
|
209
|
Gottheimer, Josh
|
D
|
NJ-5
|
Leans Dem
|
80.20
|
75.75
|
|
84.06
|
67.83
|
|
|
210
|
Gray, Adam
|
D
|
CA-13
|
Leans Rep
|
72.01
|
75.64
|
|
72.01
|
75.64
|
N/A
(1st Term)
|
|
211
|
Golden, Jared
|
D
|
ME-2
|
Leans Rep
|
69.14
|
74.01
|
|
76.38
|
66.70
|
|
|
212
|
Cuellar, Henry
|
D
|
TX-28
|
Leans Rep
|
63.68
|
71.84
|
|
74.94
|
51.32
|
|
Member's score adjusted - medical absence
Nancy Pelosi's non-votes while Speaker (customary) not counted in scores.
|

![[POW!]](images/boxer_l2.gif)